Are you overwhelmed by the sheer volume of social media metrics?
In an age where data is at the forefront of everything you do, it’s challenging to determine what information is vital.
Luckily, help is at hand.
In this post, we will show you which social metrics matter the most. You’ll discover:
- why each metric is essential to a social media marketing goal,
- examples and statistics to help measure your progress,
- and tips to improve your performance.
Are you ready?
Let’s jump in!

What Are Social Media Metrics?
Social media metrics are the data you use to determine how well your social media strategy performs.
Have you ever been in a marketing meeting with your peers ill-prepared?
It’s difficult. You cannot support your opinion, project, or campaign because you don’t have the data to back it up.
So, social media metrics set the foundations for a successful campaign.
They allow you to track data from audience growth rate and reach to the number of conversions and cost-per-click.
Why Are Social Media Metrics Important?
So, we understand social media metrics are the building blocks to a successful campaign, but how do we use these tools to create a masterpiece?
Well, with the correct data, you can continually adjust your efforts to reach your marketing goals.
Yet, just like a masterpiece, using only one source of inspiration may fall flat — so it’s wise to choose a combination of social metrics instead.
Are you looking to improve brand awareness? Look at reach, impressions, and social share of voice (SSoV).
Maybe your primary focus is return on investment (ROI)? Look at conversions, click-through rate (CTR), and cost per click (CPC).
Ultimately, your chosen metrics depend on your social media marketing goals.
10 Essential Social Media Marketing Metrics To Help Smash Your Goals
Our list of essential metrics will help you prove your social media strategy is on the right or not-so-right path.
After all, what are your efforts worth if you can’t measure results?
1. Follower Growth Rate
First up on our list is an essential brand awareness metric called follower growth rate (or “the vanity metric”).
It measures the percentage increase (or decrease) in the number of followers compared to your previous count.
You can simply check your total followers. But as a percentage, you know the growth velocity.
Whereas, if brand B has 100,000 followers and gains the same 100, the percentage gain is only 0.1%.
If your growth velocity is not increasing at the same incremental rate, you know you need to adjust your social strategy.
In addition, Social Pilot found the average monthly follower growth rate for business accounts is 1.46%.
So, what’s your growth rate? Are you lagging?
Quick Tip
One way you can improve this metric is to optimize your social media profiles.
Social Media Examiner does a great job of breaking down how to optimize your Instagram profile.

Although they focus on Instagram, you can take the lessons and implement them into your other social media profiles.
2. Social Reach
Social reach refers to the number of unique views your post receives.
So, if the same person views your post 2, 3, or even 10 times, it would only count as one view.
It’s another essential awareness metric you should use in your kick-ass social media strategy.
If Facebook is part of your social strategy, check out Facebook Insights. Amongst other things, they display reach for your organic and paid ads — highlighted in the large red circle below.
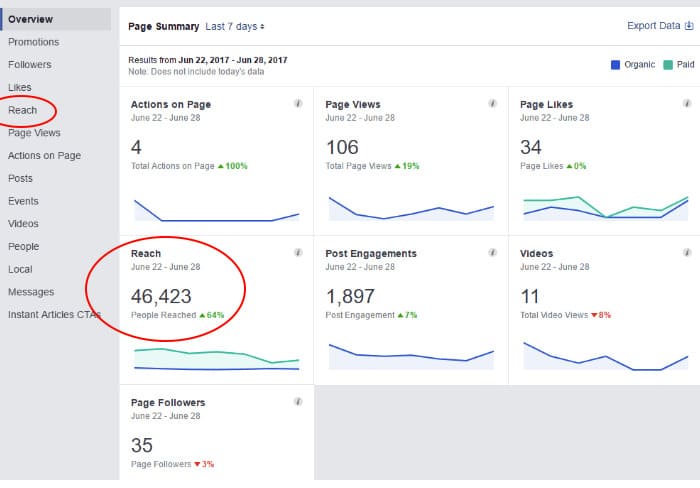
If you want to drill down further, select “Reach” on the left-hand side and see which posts resonate most with your audience.
Influencer Marketing Hub found that the average reach across each major social media platform is as follows:
- Instagram = 20%
- LinkedIn = 13%
- Facebook = 5.2%
- Twitter = 3.61%
So, jump into an analytical tool, check your social media reach, and see where you can improve.
Quick Tip
As stated above, you can use social reach to determine which posts resonate the most with your audience. So make a list and double down on this content type.
But, if you want to supercharge your results, take advantage of social media influencers in your industry.
Influencers have established credibility in your sector and a ready-made audience that will have an interest in your product or service.
Yet, choosing the right influencer type is key. So, if you want to learn which is best for you, check out 5 Social Media Influencer Types That’ll Boost Your Brand in 2024.
3. Number of Impressions
Social media impressions are the total number of times your content has been viewed. Unlike social reach, one person can count as multiple views.
Not only does it evaluate your brand awareness, but it can give you insights into both your organic and paid social traffic.
To evaluate your impressions, use a tool like Twitter Analytics.
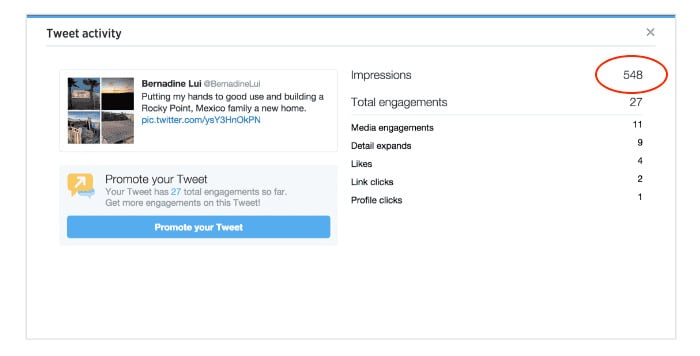
The tool allows you to monitor the total number of impressions from the dashboard and the number per tweet. Simply download the platform and click “view tweet activity” on your post.
But, how do you know if you’re on the right path?
Tweet Binder suggests an easy target to aim for is 15-20% of your followers.
So, what’s your count? Do you need to up your social media game?
Quick Tip
Increasing your reach will naturally improve your total impressions, but the real gains occur when you improve your social strategy.
Oktopost has created a handy video to help boost your impressions and increase your number of social media conversions.

Although they focus on Twitter, you can apply the same tips to the rest of your social media accounts.
4. Social Share of Voice (SSoV)
The final awareness metric that will help level up your brand is social share of voice (SSoV). It refers to the number of people talking about your brand compared to your competitors.

You can use the above equation to evaluate your SSoV but if you’re looking for ease, try Sprout Social’s social listening tools.
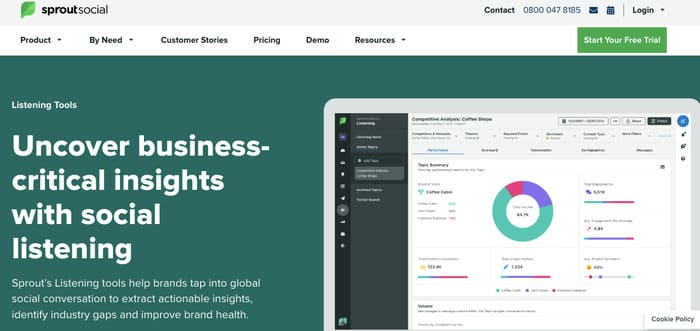
Whether you’ve opted for the manual or automatic route, SSoV plays a vital role in your social media marketing strategy. After all, it represents your visibility on social media.
For example, if your brand sells wicker baskets, you should see yourself in conversations about wicker baskets, basket weaving, and baskets in general.
So, the greater your SSoV, the more you dominate conversations in your industry.
Quick Tip
The simplest (and most effective way) to jolt your SSoV is to be active on social media.
Study your target audience to find out they’re online and post around these times. This will boost your visibility and show your audience that you have an active community worthy of their attention.
If you’re like me and always burning both ends of the candle, use a social media calendar tool to schedule your posts.
5. Engagement Rate
Engagement rate refers to all social media interactions with your posts — likes, comments, shares etc.
It must be at the core of all social media strategies as improving this metric will positively impact all other social media metrics on this list.
But how do you track it?
Jump back to Social Reach and Number of Impressions, and you will see Facebook Insights and Twitter Analytics shows your engagement rate.

On top of that, TikTok Analytics also offers a handy tool.
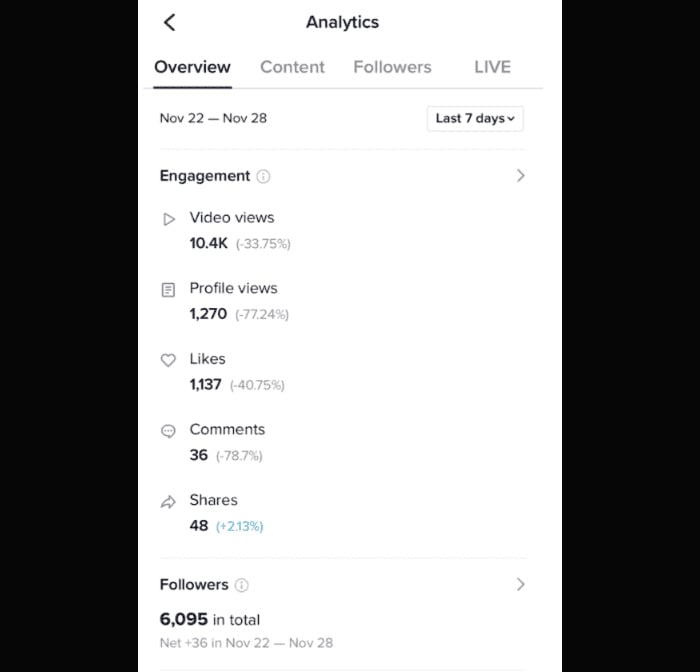
TikTok engagement is split into categories but doesn’t display the percentage. To help, use the handy calculation below:

Take the TikTok example above and input the data into the equation. Let’s say our reach is 500.
So, our engagement rate equals:
(1,137 likes + 36 comments + 48 shares) / 500 = 2.44%
Of all the social media platforms, TikTok has the most engagement, with an average rate of 5.96%.
Whereas Facebook, Instagram, and Twitter are all below 1%.
So, how do you improve this all-powerful social media metric?
Check out our tip below.
Quick Tip
To improve your engagement rate, provide content that adds value to your target audience.
View your feed and listen to your customer’s needs.
Furthermore, be yourself.
Disregard your corporate form and evolve into your everyday user. Spark conversations, be a face behind your brand, and develop a rapport with your people.
6. Response Rate
Speaking of conversations, a high response rate is crucial for customer care and conversions. Couple that with a fast response time, and you’re onto a winner.
Response rate is the percentage of your audience that you replied to that requested a response.

One crux of social media is customers expect you to answer their queries. Not only that, they expect you to do it fast.
In fact, Social Sprout found that 76% of customers expect a response within 24 hours, and 13% within an hour.
Also, have you wondered how to get that flashy “Very responsive to messages” badge on Facebook?
Well, you need a rate of 90% and a time of under 15 minutes!
So are you fast enough? What’s holding you back?
Quick Tip
If you receive multiple messages daily, then it’s tough. You may need a dedicated customer support channel and a community manager to run it.
But, if that’s not an option, then automate some of your FAQs by using chatbots to help save time and money.
7. Referrals
Monitoring your social media referrals helps you determine where a user came from before visiting your website or landing page.
Targeting your high referring channels will increase conversions and boost your social media ROI.
But, how do you track them?
The answer: Google Analytics.
It can be tricky to add your social channels and it’s a meaty topic to boot.
Luckily, our friends at Hootsuite hold your hand and take you step-by-step through the process.
Welcome back!
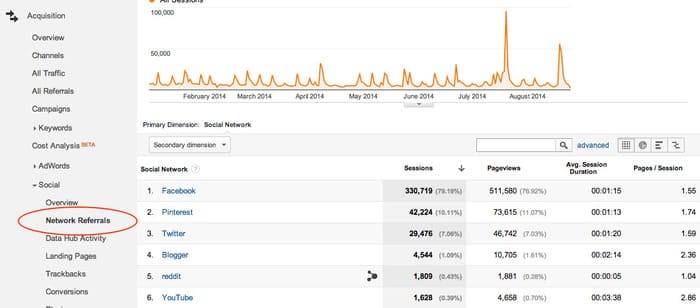
Once you’re set, click network referrals, and you’ll see the above social media report.
The number of sessions illustrates the referrals from a social media channel to your website. In this example, Facebook is leading the pack.
But what else can you do with the report?
Quick Tip
Drill down.
Use your data to inspect each page and ask yourself:
- What social channel is driving the most traffic?
- What type of content is outperforming the rest?
- How long are users engaged with your content?
Find what works and double down.
8. Conversion Rate
So, you understand where your social media traffic originates but what happens when someone clicks your Facebook ad and lands on your page?
Well, they either convert or bounce.
But what is a conversion?
For this example, it’s a sale, but it can be a download, subscription, or registration of interest for an event.
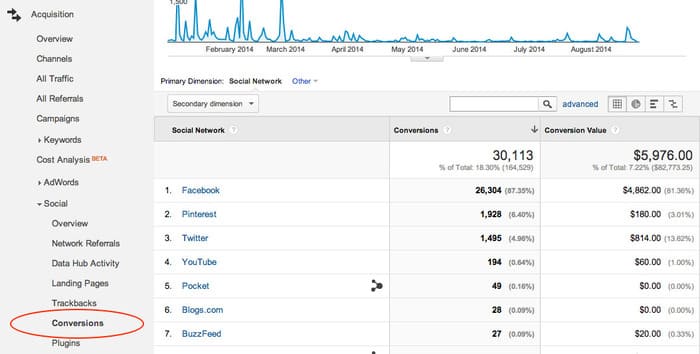
Google Analytics has another trick up its sleeve. A simple click on the conversion tab shows your total sales from each social channel.
But how do you calculate the conversion rate?
Sorry, you’ll have to do some math again. Here’s the equation:

For example, if your total number of conversions from Google Analytics is 100 and your clicks is 10,000, your conversion rate equals 1%, voila!
The average social media conversion rate is between 0.8 and 4.5%, but many businesses strive for more.
So, if you’re falling short of your mark, cast your eye over the tip below.
Quick Tip
Optimize your landing page…
There is more.
Optimizing your landing page is the most effective way to enhance your conversion rate and get a leg up on your competition. It maximizes the potential of your page and squeezes out every last conversion.
9. Click Through Rate (CTR)
Another social media conversion metric you should tap into is click-through rate (CTR). Instead of looking at the end of the sales funnel, you look at the beginning — the click.

To determine your CTR % use the above equation or Google Analytics.
Alternatively, if you have a YouTube presence, try out their analytics tool. It offers a wide variety of social media metrics, but to find your CTR, hit the reach tab.
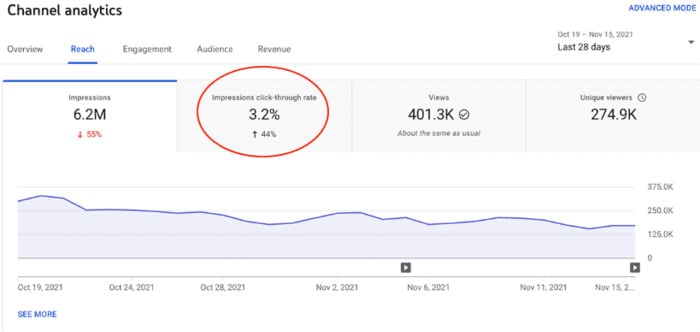
Regardless of the analytical tool, you need a ballpark figure to concentrate your efforts.
If you do a quick Google search, you will see the average CTR % for paid ads across each social platform.
But what if you’re not running paid ads? Well, it becomes tricky.
Luckily we’ve done some of the hard work for you:
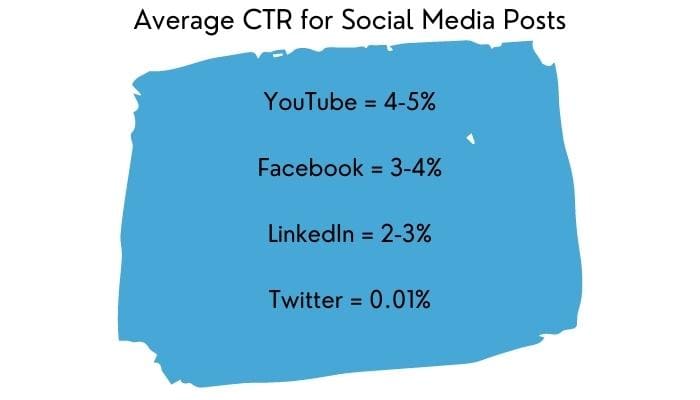
The graphic shows the average CTR for some of the major social platforms. As you can see, YouTube and Facebook are out in front, but surprisingly Twitter is way off the pace.
Essentially, if you have a low CTR, your content is falling short. It’s not resonating with your target audience and failing to provide value.
Quick Tip
So, to boost your CTR, the obvious answer, as we saw with our engagement metric, is to provide value.
Let’s take our wicker basket example from earlier. To add value, you could provide your audience with a series of posts to help users weave their own baskets.
But what else can you do?
Opt for a benefit-driven headline that entices the reader. Carrying on with our basket weaving example, you could use:
“How to Weave a Basket in 7 Simple Steps ”
It’s short, sweet, conversational, and gets to the point quickly.
10. Cost Per Click and Cost Per Conversion (CPC)
CPC can refer to cost-per-click or cost-per-conversion.
Cost-per-click relates to your ad spend. It’s the amount you pay per click on a sponsored social media post, regardless of a sale.
But, we are focusing on cost-per-conversion.
Why?
Because it’s simpler and encompasses all social media costs.

If you spend $10,000 on your social media campaign and generate 100 new conversions, your cost equals $100 per conversion. If your revenue from each is only $80, then you’ve got a problem.
So, what can you do?
To boost your CPC, you can either reduce your ad spend or increase the number of conversions.
Quick Tip
Apart from implementing all of the quick tips in this post, you can try A/B testing.
They allow you to change a variation of your post or ad while keeping the rest the same.
Are your images having the desired impact in your Instagram posts? If not, try a short video or Instagram reel.
Does a statement or a question resonate more with your audience on Twitter?
What about the length of your Facebook posts?
You get the picture.
Hitting the sweet spot will not only improve your CPC but each metric in this post.
Which Social Media Metrics Will You Choose For Your Strategy?
So, are your social media efforts worth it?
Take a couple of the social media metrics from our list and implement them into your social strategy. Evaluate your results and determine where you are excelling or falling short.
If you need to kick it up a notch, employ some of our tips.
You may have realized that most of our recommendations positively impact each metric — win, win.
So, what are you waiting for?


